Building wealth and securing your financial future often involves understanding the stock market, a vital component of any robust financial strategy. For many, the journey to learn how to invest in stocks can seem daunting, but it is made accessible through foundational knowledge and practical guidance, as demonstrated in the accompanying video.
This comprehensive guide aims to complement the visual explanations provided in the video, delving deeper into the critical aspects of beginner investing. Essential concepts are explored, from the fundamental definition of a stock to the intricacies of company evaluation and risk management. By equipping yourself with this knowledge, informed decisions can be made when engaging with the stock market, leading toward your financial objectives.
Understanding Why Investing in the Stock Market Matters
The decision to invest in the stock market is often driven by the pursuit of wealth accumulation and the preservation of purchasing power. Historically, the stock market has been recognized as one of the most effective tools for growing wealth, with an average annual return on investment (ROI) of approximately 10% over the long term. This impressive track record is a compelling argument for moving beyond traditional savings accounts.
Furthermore, investing is considered a crucial defense against inflation. When money is held purely in cash, its purchasing power is eroded over time by rising costs of goods and services. For instance, if inflation consistently runs at 3% annually, and savings accounts offer a negligible return, a significant loss in real value is experienced. Through stock market participation, one’s assets are positioned to grow at a rate that typically outpaces inflation, thus safeguarding future financial stability. The accessibility of investing has also improved dramatically; today, $0 trades and low expense ratios for solid investment vehicles like index funds and ETFs are the norm, making it cheaper than ever to start building a portfolio.
What Exactly is a Stock? Unpacking Ownership and Value
A stock is essentially a share of ownership in a company. When stock is purchased, a small “slice” of that company’s equity is acquired. This ownership grants certain rights, most commonly associated with common stock, including voting rights on company matters, though these rights are typically proportionate to the number of shares held.
Understanding a company’s market capitalization, or “market cap,” is fundamental to assessing its size and overall value. This metric is calculated by multiplying the number of shares outstanding by the current share price. For example, if a company has 7.56 billion shares outstanding and each share is priced at $216.02, its market cap would be approximately $1.633 trillion. This figure provides a quick snapshot of the company’s scale and is often used by investors to categorize businesses and compare them within their respective industries. Market cap changes with shifts in share price and the number of shares outstanding, reflecting the dynamic nature of a company’s perceived value in the market.
Why Do Companies Issue Stocks?
Companies issue stocks primarily to raise capital for various business needs. This process, often initiated through an Initial Public Offering (IPO), allows companies to receive money from the general public in exchange for equity. The funds generated from stock issuance can be allocated for diverse purposes, including financing new product lines, investing in research and development, expanding operations, or paying down existing debt. Occasionally, companies also engage in stock buybacks, which reduce the number of shares outstanding, potentially increasing the value of remaining shares by consolidating ownership.
Common vs. Preferred Stock: Key Distinctions
While the focus for most beginner investors is on common stock, it is helpful to be aware of preferred stock. Common stock offers voting rights and the potential for capital appreciation, but common shareholders are typically last in line to be paid out in the event of a company’s liquidation. Preferred stock, conversely, usually carries no voting rights but offers a fixed dividend payment and a higher priority in receiving payments during liquidation, making it a less risky option for income-focused investors.
Categorizing Stocks: Cap Sizes, Growth Potential, and Sectors
Stocks are categorized in several ways, helping investors to understand their characteristics and potential roles within a portfolio. These classifications include market capitalization, investment style, and industry sector.
Market Capitalization: Large, Mid, and Small Cap
Market capitalization is a primary classification for stocks. Large cap companies are those with a market cap of $10 billion or more. These are typically well-established entities, like Johnson & Johnson or Pfizer, known for their proven track records and often offering regular dividends. While they may not achieve rapid, massive growth due to their size, they often provide stability. Mid cap stocks, with market caps between $2 billion and $10 billion, represent companies with more established histories than small caps but still possess significant growth potential. They are frequently targets for mergers and acquisitions (M&A) by larger companies. Small cap stocks, ranging from $300 million to $2 billion in market cap, are typically younger companies seeking aggressive growth. These carry higher risk and usually do not offer dividends, as their earnings are reinvested back into the business for expansion.
Growth, Income, and Value Stocks
Beyond size, stocks are also categorized by their investment style. Growth stocks, such as Amazon or Facebook, are companies with high potential for future growth, often outpacing the broader market. They typically reinvest their earnings into the business, leading to low or no dividends. Income stocks, exemplified by companies like Verizon or 3M, are known for paying regular dividends. These are often mature companies with stable business models and consistent dividend increases. Value stocks are perceived to be trading below their intrinsic fundamental value. Investors often seek these “undervalued” companies, believing their market price will eventually rise to reflect their true worth, much like finding a diamond in the rough. These classifications are not mutually exclusive; a company might exhibit characteristics of both growth and value, or a large-cap company might also be considered an income stock.
Stock Sectors: Diving into the Economic Landscape
The economy is divided into 11 broad sectors, which are groups of businesses sharing similar products or services. Understanding these sectors is crucial for diversification and identifying investment opportunities:
- Energy: Oil, gas, coal, fuel (e.g., Exxon Mobil).
- Materials: Chemicals, metals, paper (e.g., Dow Inc.).
- Industrials: Defense, aerospace, manufacturing (e.g., Boeing, Lockheed Martin).
- Consumer Discretionary: Apparel, household products, leisure (e.g., Nike).
- Consumer Staples: Food, beverages, household goods (e.g., Walmart, Coca-Cola).
- Healthcare: Pharmaceuticals, equipment, services (e.g., Johnson & Johnson, Medtronic).
- Financials: Banks, insurance, investment firms (e.g., KeyBank, Wells Fargo).
- Information Technology (IT): Internet, software, semiconductors (e.g., Microsoft, Apple, Tesla). This sector has experienced significant growth over the past decade.
- Telecommunication Services: Mobile and internet providers (e.g., AT&T, Verizon).
- Utilities: Electric, gas, water companies (e.g., NextEra Energy).
- Real Estate: Real estate investment trusts (REITs) for apartments, malls, office space.
Diversifying investments across various sectors can help mitigate risk, as different sectors perform differently depending on economic conditions.
Navigating the Waters: Understanding Investment Risk
Risk is an inherent part of investing, and understanding its various forms is critical for managing expectations and protecting capital. Investors are compensated for the amount of risk undertaken, meaning higher potential returns often come with higher risk. Risk is defined as the chance that the actual investment outcome will differ from the expected outcome, including the possibility of losing some or all of the initial investment.
Several types of risk commonly affect investors:
- Market Risk: This is the risk that the entire market or a broad segment of it will decline, impacting nearly all investments. The 2008 financial crisis serves as a stark example of pervasive market risk.
- Liquidity Risk: This refers to the difficulty of selling an investment quickly without significantly impacting its price. Highly illiquid assets, such as a remote warehouse, may be hard to sell when needed.
- Concentration Risk: This occurs when too much capital is allocated to a single asset, industry, or sector, leading to an overly concentrated portfolio. A common example is having all eggs in one basket, making the portfolio highly vulnerable to specific company or industry downturns.
- Credit Risk: The risk that a company or entity will be unable to repay its debts or meet its financial obligations, potentially leading to bankruptcy and losses for investors.
- Inflation Risk: The risk that inflation will erode the purchasing power of an investment’s returns over time. As discussed, holding cash can lead to a loss of purchasing power if inflation outpaces interest rates.
- Horizon Risk: This relates to changes in an investor’s time frame for an investment. If an investment intended for a 10-year horizon must be sold after only one year due to unforeseen circumstances, the investor may not realize the expected returns.
- Foreign Investment Risk: Investing in foreign companies or markets introduces unique risks, including currency fluctuations, political instability, and differing regulatory environments.
Effective risk management involves diversification and careful consideration of one’s risk tolerance and investment objectives. While stocks do not always go up, as is humorously noted, understanding and mitigating these risks allows for more robust investment decisions.
Exploring Investment Vehicles: Beyond Individual Stocks
While direct ownership of individual stocks is a popular method of investing, several other vehicles allow for participation in the stock market, each with distinct advantages and disadvantages. These options are crucial for building a diversified portfolio that aligns with varying investment goals and risk appetites.
Individual Stocks: Direct Ownership
Individual stocks represent direct ownership in a specific company. A primary benefit is the potential for significant returns if the chosen company performs well. There are often reduced or no fees to buy and maintain these, as no professional manager is being paid. This allows for complete control and a deeper understanding of what is owned, provided due diligence is performed. However, individual stocks present challenges, particularly in achieving adequate diversification; 20 to 100 different companies might be needed to mitigate concentration risk effectively. Monitoring such a portfolio demands considerable time and effort, including reviewing financial reports. Emotional factors like the Fear Of Missing Out (FOMO) can also lead to impulsive and potentially poor investment decisions.
Mutual Funds: Professionally Managed Pools
Mutual funds are professionally managed investment funds that pool money from many investors to purchase a diversified portfolio of securities. They offer extreme liquidity, making them easy to buy and sell. Diversification is a key advantage, as a single fund invests in a wide array of assets. Most mutual funds benefit from professional management, whether active (human managers) or passive (tracking an index). However, actively managed mutual funds typically come with higher fees, often including management fees and expense ratios. It should also be noted that mutual funds are generally not FDIC insured, unlike bank savings accounts. Large cash holdings within mutual funds can also dilute returns, especially during inflationary periods.
Index Funds: Tracking the Market
Index funds are a specific type of mutual fund or ETF designed to track the performance of a particular market index, such as the S&P 500 or NASDAQ. These funds are known for their extremely low fees, especially when passively managed, as they simply replicate an index rather than requiring active decision-making. Studies have shown that index funds often outperform actively managed funds over the long term. Their simplicity makes them easy to own, manage, and invest in, aligning well with long-term financial goals. A drawback is the lack of control over individual holdings; investors accept the composition of the index. They also lack downside protection, meaning they are fully exposed to market downturns without hedging strategies.
Exchange Traded Funds (ETFs): Flexible Baskets of Stocks
ETFs are similar to index funds in that they are baskets of stocks designed to mimic a market sector or index, but they trade on an exchange like individual stocks. This offers investors access to many stocks through a single share, enabling broad diversification with a single purchase. ETFs typically have very low expense ratios, passing cost savings to investors. They are generally easy to own and manage. Like index funds, actively managed ETFs might have slightly higher fees, and they also lack inherent downside protection. Diversification can be limited if an ETF focuses on just one industry, potentially increasing specific sector risk.
Real Estate Investment Trusts (REITs): Accessible Real Estate
REITs are companies that own, operate, or finance income-producing real estate. They provide an accessible way for individual investors to participate in the commercial real estate market, an asset class historically reserved for wealthier investors. REITs offer stable cash flow through dividends, as they are legally required to pay out at least 90% of their taxable income to shareholders annually. Historically, commercial real estate has been a sound asset class for wealth building. However, REIT dividends are taxed as regular income, which can be less tax-efficient than qualified stock dividends. They are also subject to market risk; commercial real estate values can decline significantly during economic downturns, as witnessed in 2008. High management fees can also sometimes be associated with these investments.
Evaluating a Company: Essential Financial Ratios
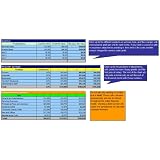
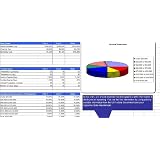
Before investing in individual stocks, it is paramount to evaluate a company’s financial health and valuation. This process involves analyzing financial statements and using key financial ratios, which provide insights beyond surface-level observations. The three primary financial statements are the balance sheet (a snapshot of assets, liabilities, and equity at a specific point), the income statement (showing revenues and expenses over a period), and the cash flow statement (detailing cash inflows and outflows from operations, investing, and financing activities).
Key Financial Ratios for Stock Analysis
Several ratios are commonly used to assess a company:
- Price-to-Earnings (P/E) Ratio: This valuation ratio compares a company’s share price to its earnings per share, indicating how much investors are willing to pay for each dollar of earnings. A historically healthy P/E ratio for value investors was often 15 or lower. For example, if Microsoft’s share price is $225.56 and its trailing 12-month earnings per share (EPS) is $6.2, its P/E ratio would be approximately 36.38. This higher value suggests the market expects significant future growth or that the stock might be overvalued by historical standards.
- Price/Earnings to Growth (PEG) Ratio: The PEG ratio refines the P/E ratio by factoring in the company’s expected earnings growth. It is calculated by dividing the P/E ratio by the annual earnings per share growth rate. A PEG ratio of 1 or less is often considered favorable, indicating that a stock might be undervalued relative to its growth potential. If Microsoft’s P/E is 36.38 and its estimated long-term annual growth is 14.55%, the PEG ratio would be around 2.49, suggesting its price is somewhat elevated compared to its projected growth.
- Price-to-Book (P/B) Ratio: This valuation ratio compares a company’s market cap to its book value (total assets minus total liabilities). It indicates how much investors are paying for the net assets of a company. A P/B ratio of 3 or lower is generally considered healthy. Microsoft’s P/B ratio of 13.66 suggests that the market values the company significantly higher than its accounting book value, often due to intangible assets or high growth expectations.
- Return on Assets (ROA): This profitability ratio measures how efficiently a company uses its assets to generate earnings. It is calculated as net income divided by total assets. An ROA of 5% or higher is typically considered strong. Microsoft’s ROA of 16.2% indicates highly efficient asset utilization.
- Return on Equity (ROE): Another profitability ratio, ROE measures a company’s efficiency in generating profits relative to the equity invested by its shareholders. It is calculated as net income divided by shareholders’ equity. A high ROE, such as Microsoft’s 40.7%, suggests excellent profitability and efficient use of shareholder funds.
- Current Ratio: This liquidity ratio assesses a company’s ability to pay off its short-term obligations (due within one year). It is calculated by dividing current assets by current liabilities. A ratio between 1.5 and 2.0 is often considered healthy, indicating sufficient liquid assets to cover immediate debts.
- Quick Ratio (Acid-Test Ratio): A more conservative liquidity ratio, it measures a company’s capacity to pay current liabilities without relying on inventory sales. It includes cash, marketable securities, and accounts receivable, divided by current liabilities. An ideal quick ratio is often 1:1 or higher, demonstrating strong liquidity. Microsoft’s quick ratio of 2.5 suggests a very robust ability to meet its short-term obligations.
- Debt-to-Equity (D/E) Ratio: This debt/solvency ratio gauges a company’s financial leverage by comparing total liabilities to total shareholders’ equity. A lower D/E ratio indicates that a company relies less on debt financing, implying lower financial risk. For instance, a company with a D/E of 0.5 (e.g., $50,000 in loans for $100,000 in equity) is generally considered less risky than one with a D/E of 5.0 ($100,000 in loans for $20,000 in equity).
- Asset Turnover Ratio: An efficiency ratio, it measures how effectively a company uses its assets to generate sales or revenue. It is calculated as total sales divided by average total assets. A higher asset turnover ratio is preferable, indicating that assets are being utilized efficiently to produce revenue. For example, Walmart, with an asset turnover of 2.3, demonstrates greater efficiency in generating sales from its assets compared to AT&T, with an asset turnover of 0.41.
While these ratios provide valuable insights, it is important to remember that they are often subjective and should be interpreted within the context of the company’s industry, business model, and overall economic environment. A “healthy” ratio can vary significantly between a high-flying tech stock and a conservative utility company.
Executing Trades: Buying and Selling Stocks
The practical step of buying and selling stocks can be simplified through modern brokerage platforms. Platforms like Robinhood, M1 Finance, and WeBull have democratized access to the stock market, often offering free stock upon signing up and simplifying the trading process, as highlighted in the video’s live demonstration of a Microsoft stock purchase. When making a trade, understanding order types is crucial for ensuring the desired outcome.
Market Orders vs. Limit Orders
- Market Order: A market order instructs the brokerage to buy or sell a stock immediately at the best available current market price. While it guarantees execution, the exact price cannot be guaranteed, especially in volatile markets where prices can fluctuate rapidly. For beginners prioritizing quick execution, market orders are straightforward. For example, a $50 market order to buy Microsoft would execute at whatever the prevailing price is at that moment.
- Limit Order: A limit order allows an investor to specify the maximum price they are willing to pay for a buy order or the minimum price they are willing to accept for a sell order. This offers price control but does not guarantee execution. For instance, if Microsoft is trading at $225.13, but an investor wishes to buy only if the price drops to $224.30, a limit order can be placed. The order will only execute if the stock’s price reaches or crosses the specified limit. Limit orders can be set as “good for day” (expires at the end of the trading day) or “good till canceled” (remains active for a specified period, often 90 days). This method is often recommended for beginners who have a specific price target in mind and wish to avoid potential price swings.
While more advanced order types like stop-loss or trailing stop orders exist, they are generally beyond the scope of initial beginner investing and are best explored after a solid understanding of market and limit orders is established. The ease of setting up these orders through intuitive interfaces greatly simplifies the process of making your first investment in stocks.
Understanding Tax Implications: Capital Gains and Losses
Engaging in stock market activities carries tax implications that every investor should comprehend. When stocks are bought and sold, the resulting profit or loss is typically categorized as a capital gain or a capital loss.
- Capital Gain: A capital gain occurs when a stock is sold for a price greater than its purchase price. For example, buying a stock for $100 and selling it for $110 results in a $10 capital gain.
- Capital Loss: Conversely, a capital loss happens when a stock is sold for a price less than its purchase price. If a stock purchased for $110 is sold for $100, a $10 capital loss is incurred.
These gains and losses are further categorized based on the holding period of the investment:
- Short-Term Capital Gain or Loss: This applies when an asset is held for one year or less before being sold. Short-term capital gains are typically taxed as regular income, meaning they are subject to an individual’s ordinary income tax bracket.
- Long-Term Capital Gain or Loss: This applies when an asset is held for more than one year before being sold. Long-term capital gains are taxed at more favorable rates than regular income, typically 0%, 15%, or 20%, depending on the investor’s income tax bracket and filing status.
Understanding these distinctions is vital for tax planning and optimizing investment returns. Strategic consideration of holding periods can significantly impact the net profit retained from successful investments. For instance, an investor who held Microsoft stock for five years, seeing a 306% return from $55.48 to $225 per share, would typically benefit from the lower long-term capital gains tax rates on their substantial profits.
Unpacking the Stock Market: Your Beginner Questions Answered
Why should I consider investing in the stock market?
Investing in the stock market helps you build wealth over the long term and protect your money from inflation. Historically, it has provided higher returns than just keeping money in a savings account.
What exactly is a stock?
A stock is essentially a share of ownership in a company. When you buy a stock, you are purchasing a small ‘slice’ of that company’s business.
What are ETFs and Index Funds, and how are they different from individual stocks?
ETFs (Exchange Traded Funds) and Index Funds are collections of many different stocks bundled together, offering instant diversification. Unlike individual stocks, where you own one company, these allow you to invest in a broad market or sector with a single purchase.
How do I actually buy or sell a stock?
You can buy or sell stocks through a brokerage platform, like Robinhood. You typically use a ‘market order’ to buy or sell immediately at the current price, or a ‘limit order’ to set a specific price you want to trade at.